How StratSim approaches a decision.
StratSim takes a real corporate decision and models how the people around it respond — over eighteen months, and to each other, not only to the decision itself.
What follows is what StratSim examines and what you receive. How the analysis is produced is ours; what it covers, what it can tell you and what it cannot are set out plainly below.

Multiple strategic perspectives, each with something to protect.
A decision looks different depending on where you sit. StratSim examines one from the positions that will determine its outcome — the executive whose reputation is attached to it, the client who can leave, the regulator who sets precedent, the competitor who stands to gain. Each holds objectives that conflict with the others.
Perspectives spanning executives, boards, regulators, competitors, counterparties, investors, employees and customers — across corporate leadership, private equity, banking, healthcare, government, consumer, hospitality and technology. Those brought to bear on a given decision are the ones it actually implicates.
Perspectives are composites, not portraits. They are built from role, incentive and institutional position — never from real named individuals — and are named fictionally so they cannot be mistaken for them.
An influence map of the kind produced by every simulation. Each ring shows a perspective’s final position; line weight shows the tension between two parties by the end of the run. Roles shown are generic — no engagement is depicted.
Six periods across eighteen months.
Consequences are rarely visible in the first quarter. The horizon is set at eighteen months because that is where most institutional decisions reveal their real cost.
Grounded in your own documents.
A simulation run on a paragraph of description is worth less than one run on the actual material. Financial statements, board packs, org charts, contracts and transcripts can all be supplied.
Up to five documents per simulation, in PDF, Excel, Word, or plain text and CSV. Spreadsheets are read as structured data rather than flattened to prose, so figures and org structures survive intact.
Documents are read and incorporated into the analysis. Where a document is long, it is condensed first — preserving figures, names, dates and terms — so that nothing decision-relevant is lost to truncation.
What you receive.
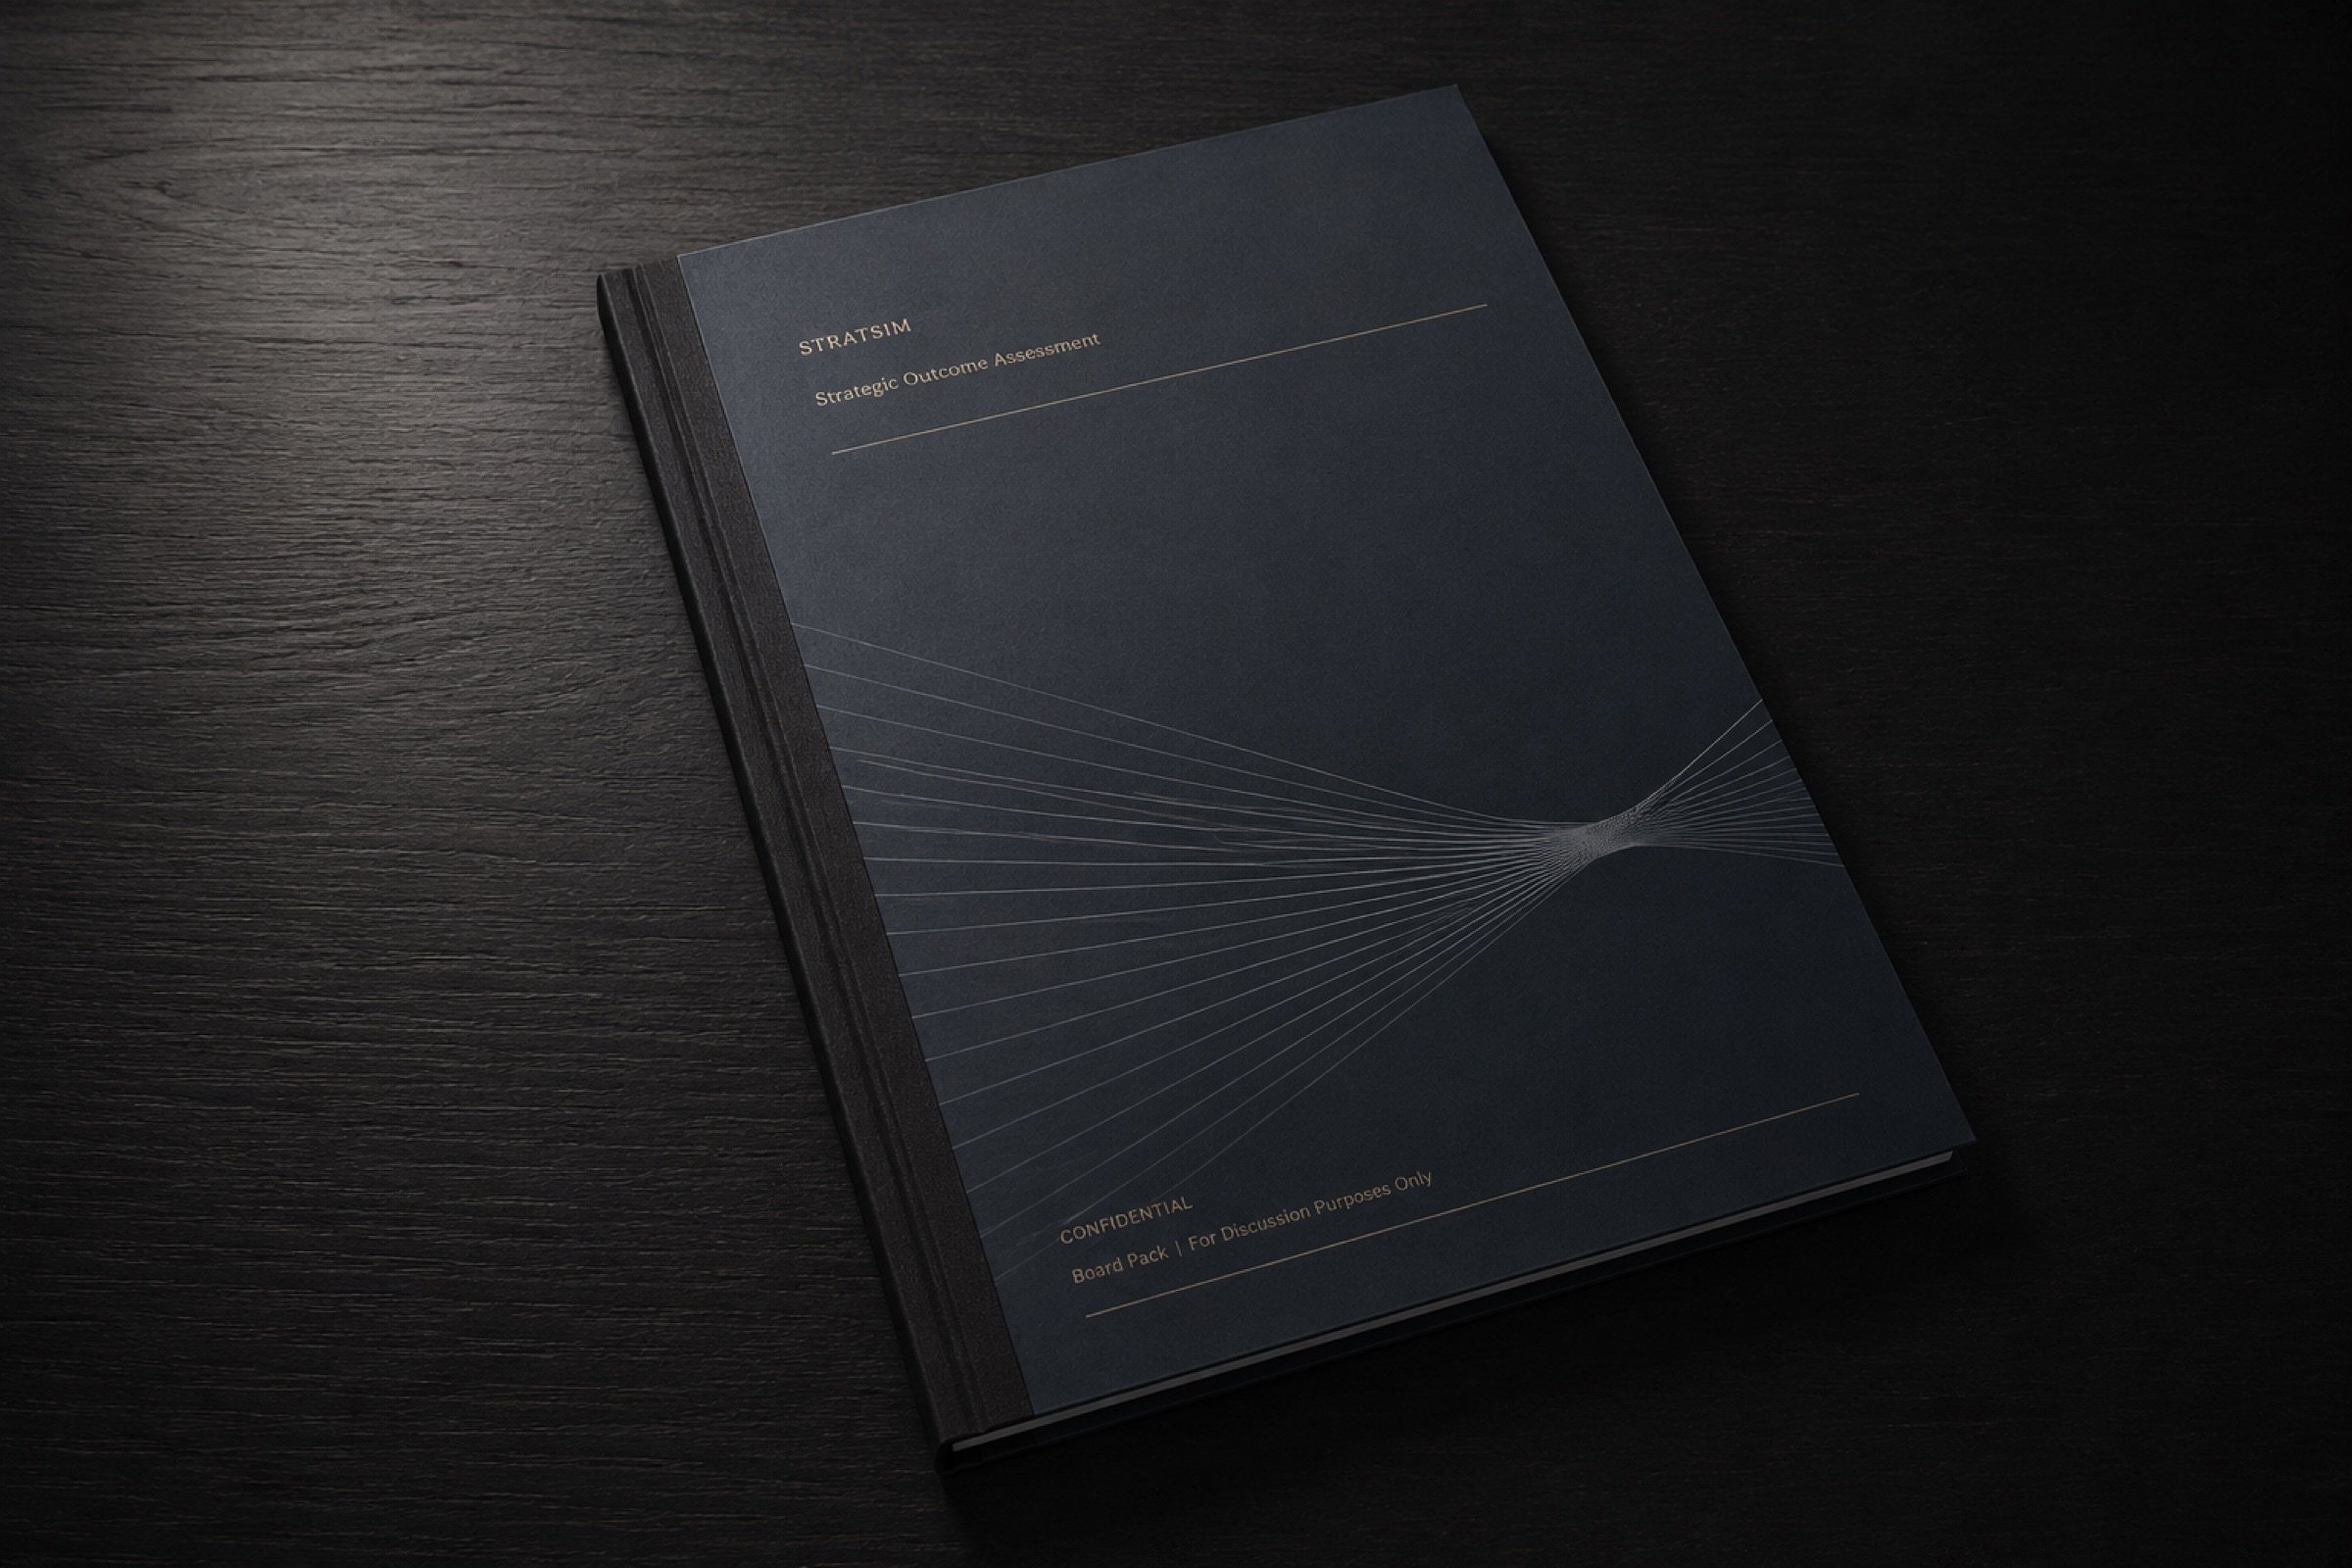
A written assessment, structured so the next decision is obvious. It is intended to go into a board pack, not to be read on a screen.
A headline finding — the outcome in one sentence.
An executive readout of what happened and why.
Five measures: risk exposure, talent at risk, client churn, revenue impact, recovery period.
An influence map showing which parties drove the outcome.
Each perspective’s final position, its stated reasoning, and the action taken.
An 18-month sequence of events, with the second-order effects each one set off.
The actions indicated, and the finding standard analysis would have missed.
The resulting intelligence is scrutinised and validated by our team before being delivered to the client. Technology-led, human-validated.
Once the analysis is complete, any perspective can be questioned directly. It answers from its own position and history, which is the fastest way to find out whether its reasoning holds or falls apart under pressure.
Successive decisions within one engagement are examined in light of one another, so a sequence can be read as a sequence rather than in isolation. Analysis is never carried between separate clients or engagements.
Exploratory, directional, and for professional review.
The output is not a prediction and the figures are not probabilities. What a simulation gives you is the shape of what follows — the order in which things break, and which party sets them off. Findings should be verified independently before they are acted on.
Names, characters and quotations are fictional and generated. They do not represent real individuals or organisations, and any resemblance is coincidental.
Discuss a decision with us.
If something here does not answer what you need to know before commissioning work, ask directly.
Contact StratSim